Overview
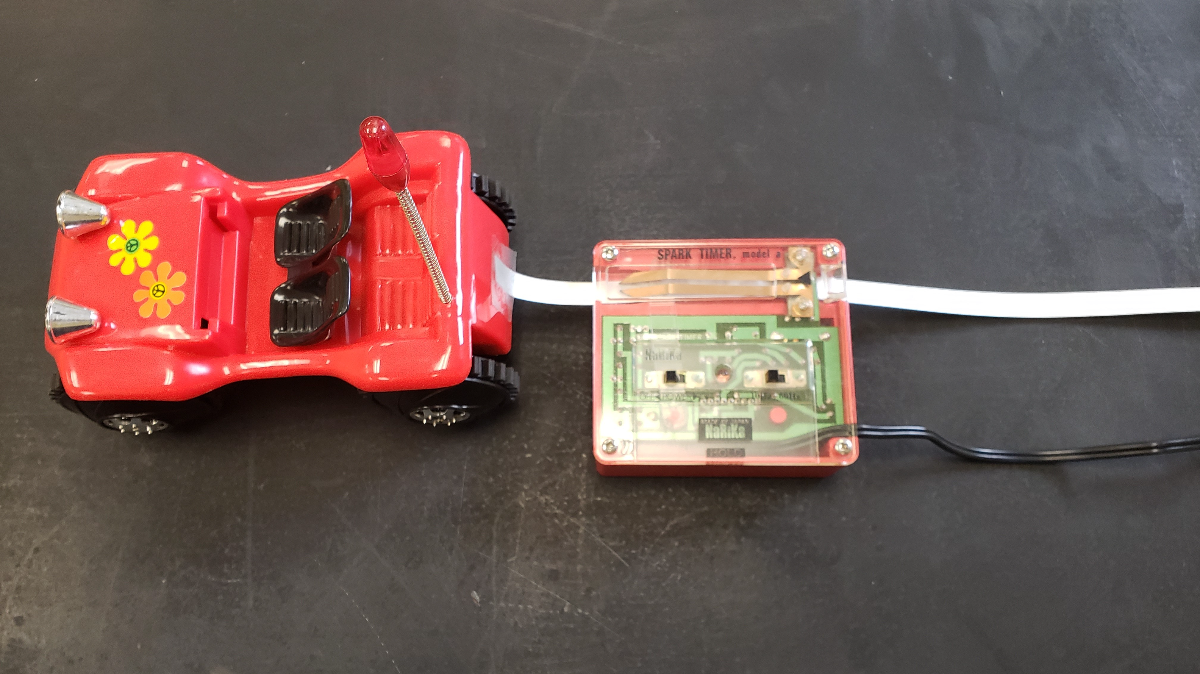
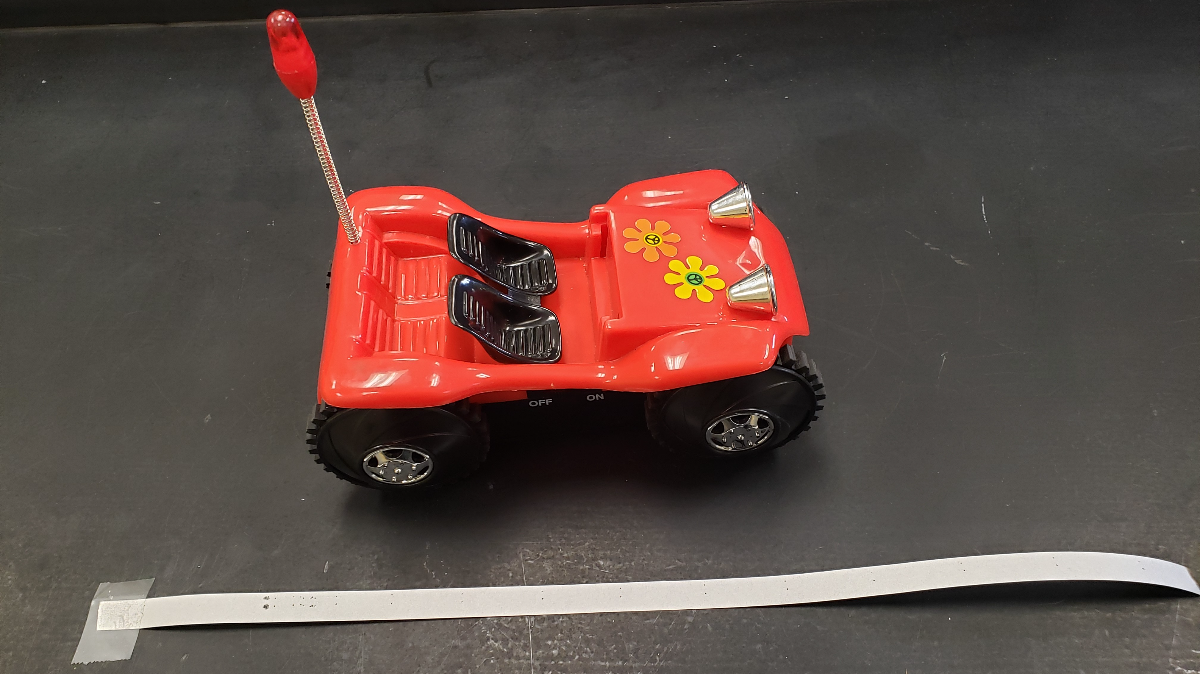
The investigation opens with students working as a class as they make predictions and observations of the spacing of bean bags dropped from a cart pulled at different velocities. The students then use spark timers and toy cars to generate a pattern similar to the bean bags on the spark timer tape. Ultimately the students use the tape to create a graphical representation of constant velocity motion. The relationship between the physical motion and graphical representation is then discussed.
- Grades 4-12
- In person only
- Requires basic familiarity with graphical representations of data.
- The use of a classroom with outlet access throughout the room is required.
Materials
- Spark timer
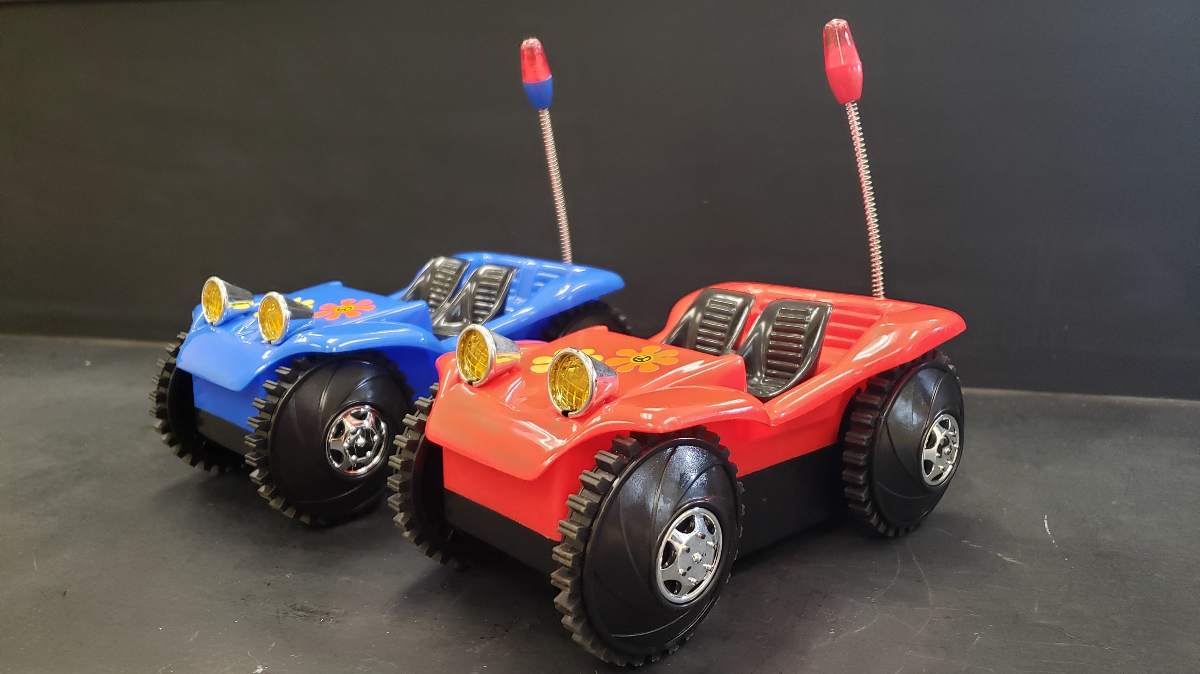
- Constant velocity toy car
- Battery spacers
- Scissors
- Glue
- Spark timer
- Constant velocity toy car
- Battery spacers
- Scissors
- Glue
Follow Up and Resources
This can be an effective launch point to dig into other graphical representations of motion. Check out the following for more information:
- Our Walk This Way investigation which unpacks position-time graphs.
- The Moving Man simulation from PhET.
This can be an effective launch point to dig into other graphical representations of motion. Check out the following for more information:
- Our Walk This Way investigation which unpacks position-time graphs.
- The Moving Man simulation from PhET.
Standards
Motion of Objects
- SC.6.P.12.1: Measure and graph distance versus time for an object moving at a constant speed. Interpret this relationship.
Motion
- SC.912.P.12.2: Analyze the motion of an object in terms of its position, velocity, and acceleration (with respect to a frame of reference) as functions of time.
The Practice of Science
- SC.4.N.1.1: Raise questions about the natural world, use appropriate reference materials that support understanding to obtain information (identifying the source), conduct both individual and team investigations through free exploration and systematic investigations, and generate appropriate explanations based on those explorations.
- SC.5.N.1.1: Define a problem, use appropriate reference materials to support scientific understanding, plan and carry out scientific investigations of various types such as: systematic observations, experiments requiring the identification of variables, collecting and organizing data, interpreting data in charts, tables, and graphics, analyze information, make predictions, and defend conclusions.
- SC.6.N.1.1/SC.7.N.1.1/SC.8.N.1.1: Define a problem from the sixth/seventh/eighth grade curriculum, use appropriate reference materials to support scientific understanding, plan and carry out scientific investigation of various types, such as systematic observations or experiments, identify variables, collect and organize data, interpret data in charts, tables, and graphics, analyze information, make predictions, and defend conclusions.
- SC.912.N.1.1:
- Use tools to gather, analyze, and interpret data (this includes the use of measurement in metric and other systems, and also the generation and interpretation of graphical representations of data, including data tables and graphs), (Collect data or evidence in an organized way. Properly use instruments, equipment, and materials (e.g., scales, probeware, meter sticks, microscopes, computers) including set-up, calibration, technique, maintenance, and storage).